2022 Opening Minds to Science
The Saint Louis Science Center’s Report to the Community
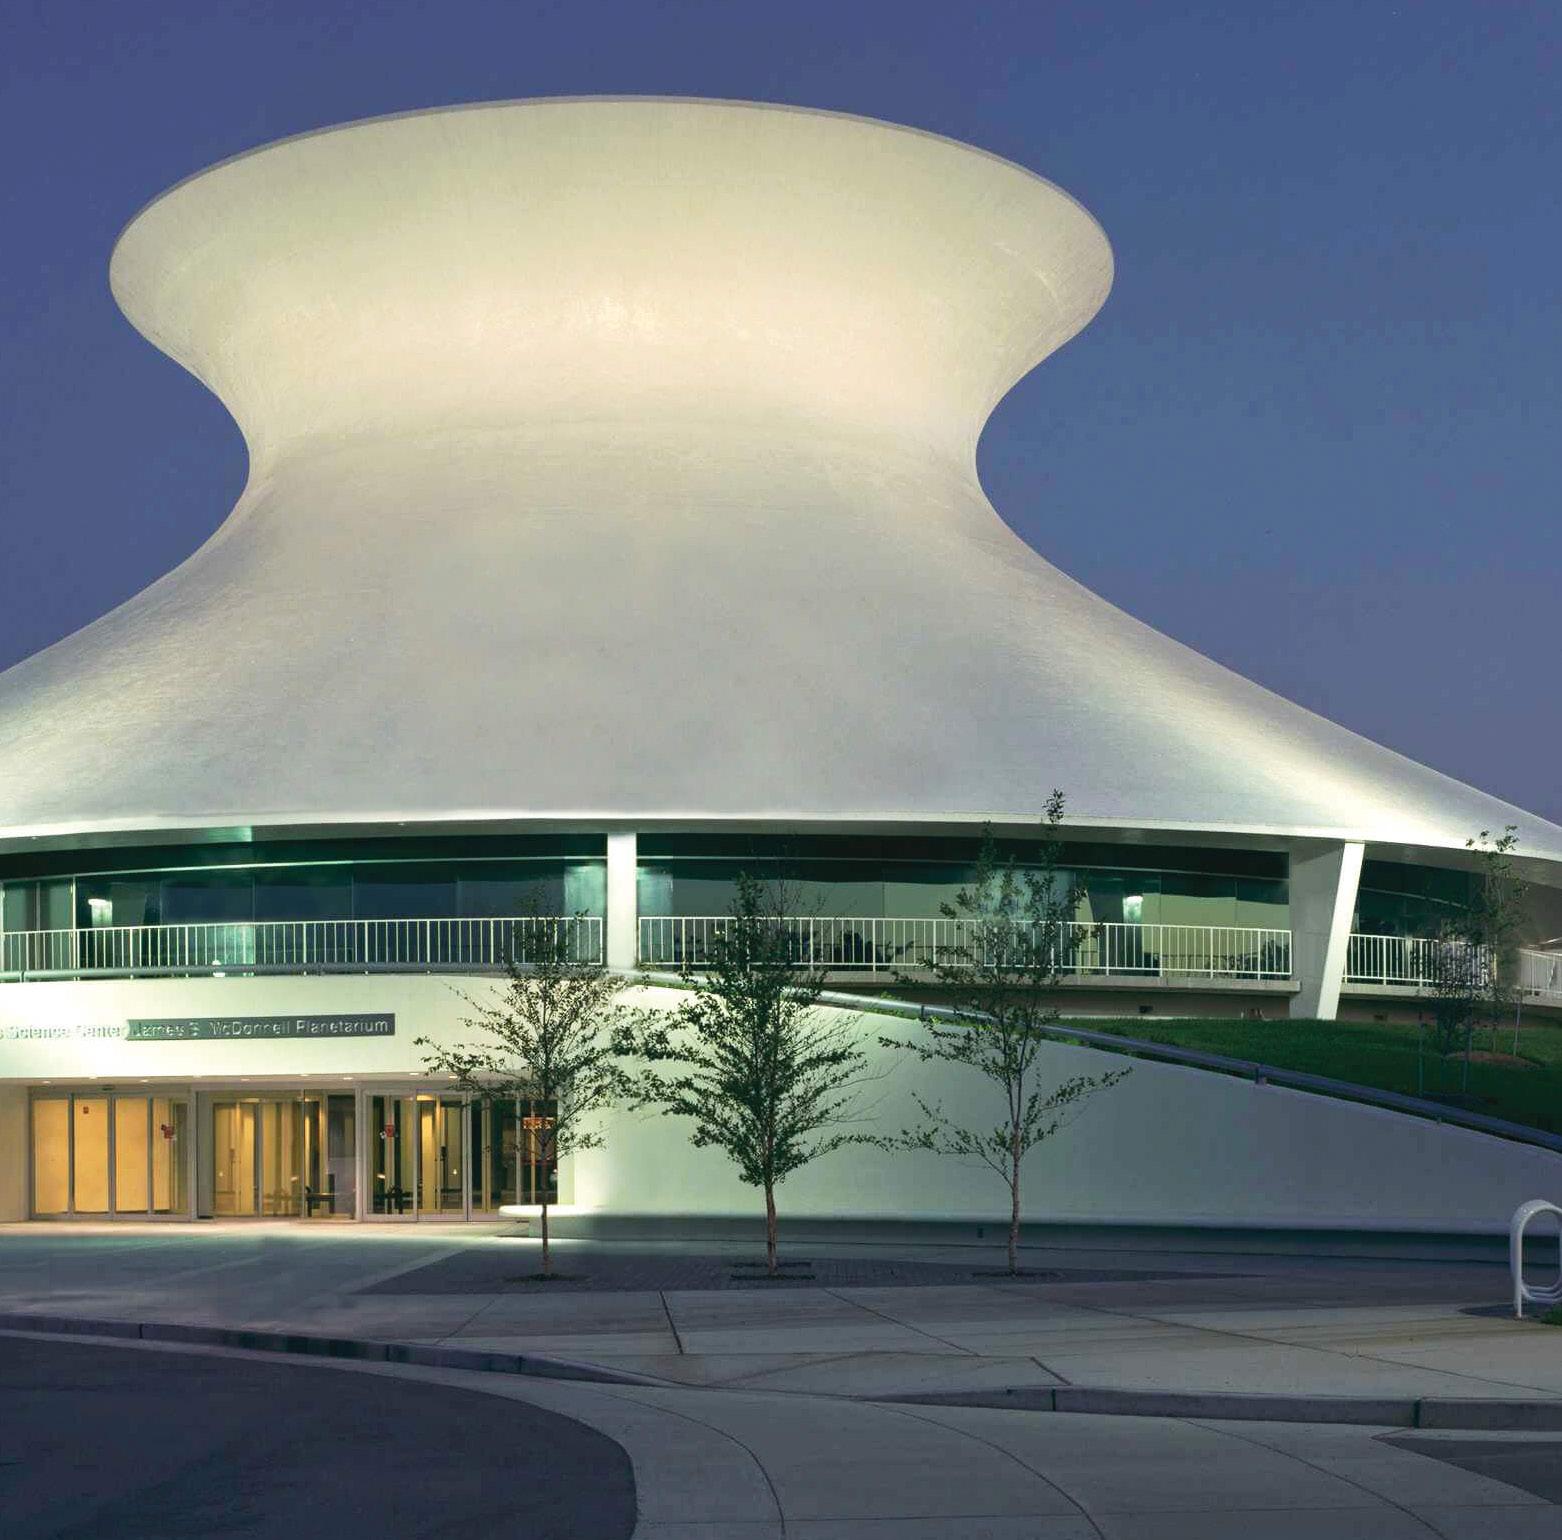
“First time seeing a planetarium show and it was fantastic. We will be back to see other shows at the planetarium.”
Science Center Guest
June 2022
“I loved the Science Center as a child and it’s still fascinating today. Love seeing my child’s reaction of wonder.”
Science Center Guest
June 2022
“Educational, fun and free!”
Science Center Guest
October 2022
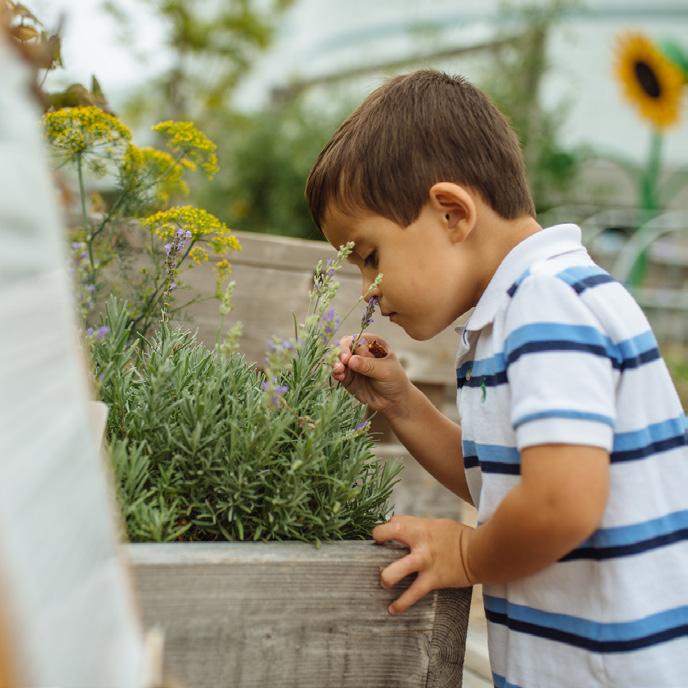
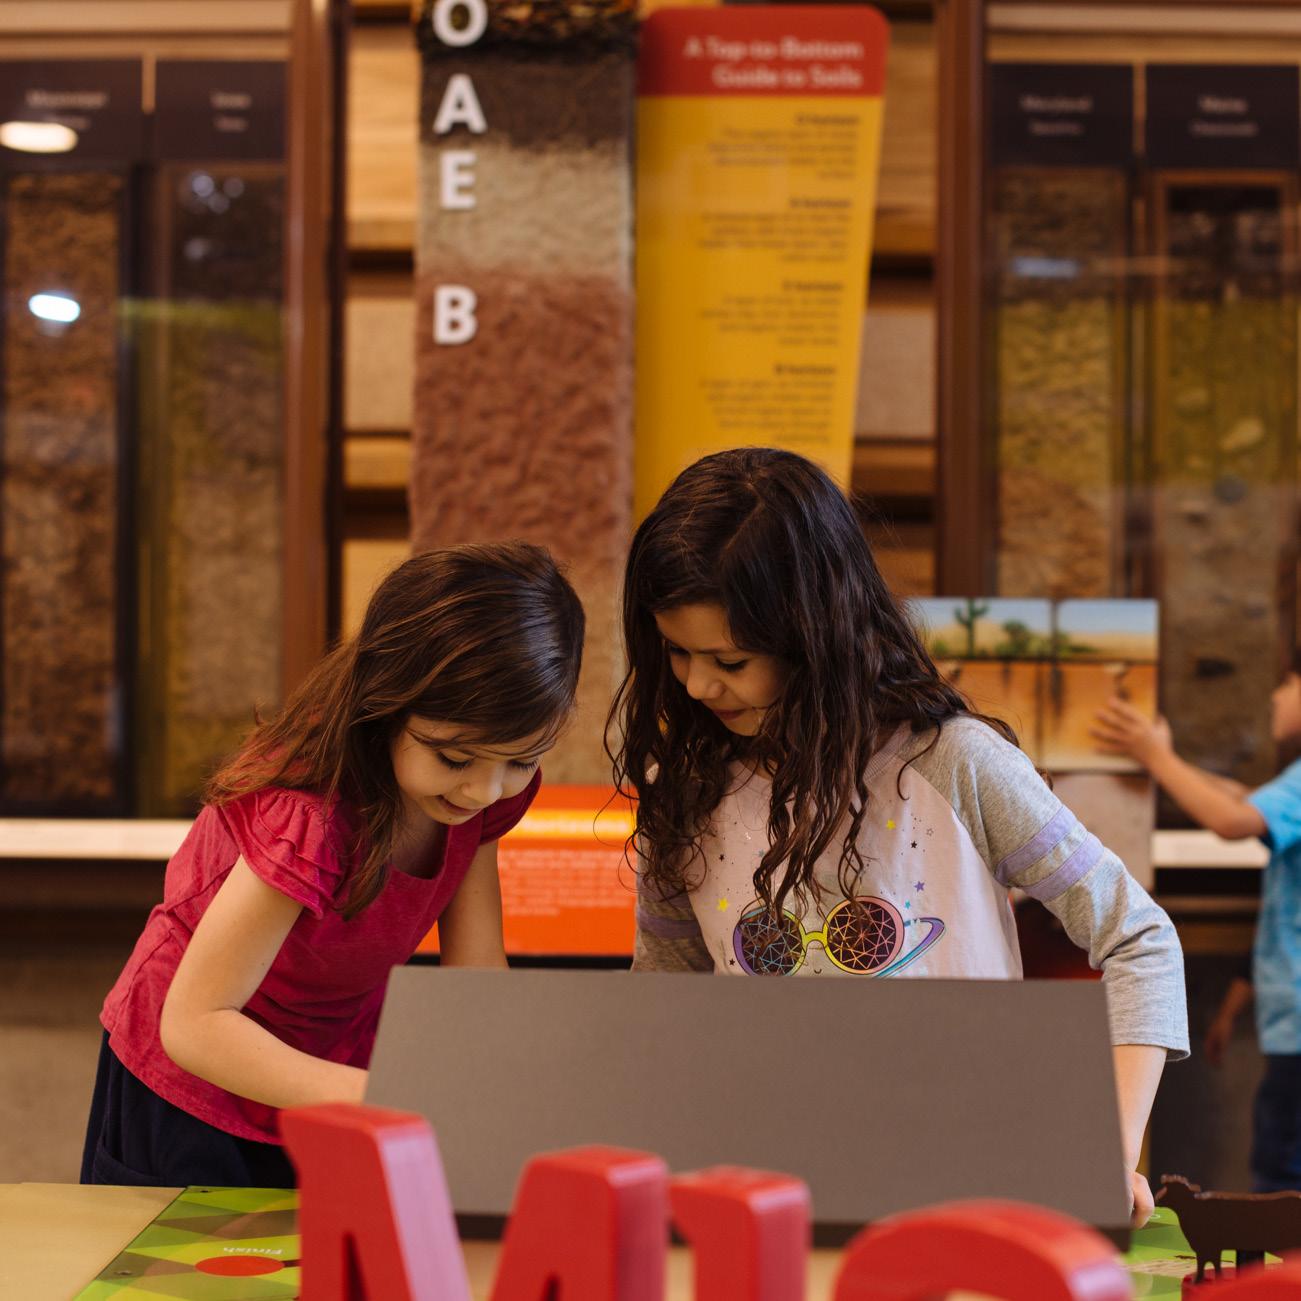
“ We loved the farming gardens, science lab, dinosaurs, and game room display.”
Science Center Guest
May 2022
“We always enjoy our visit to the Saint Louis Science Center. There is always something new to see.”
Science Center Guest
September 2022
“ We always have fun at the Science Center! We have been members for years and have fun with all of the exhibits, new and old. My kids loved the cardboard maker space.”
Science Center Guest
February 2022
“It was an amazing time! The staff here is what makes the experience better than other places in the city.”
Science Center Guest
April 2022
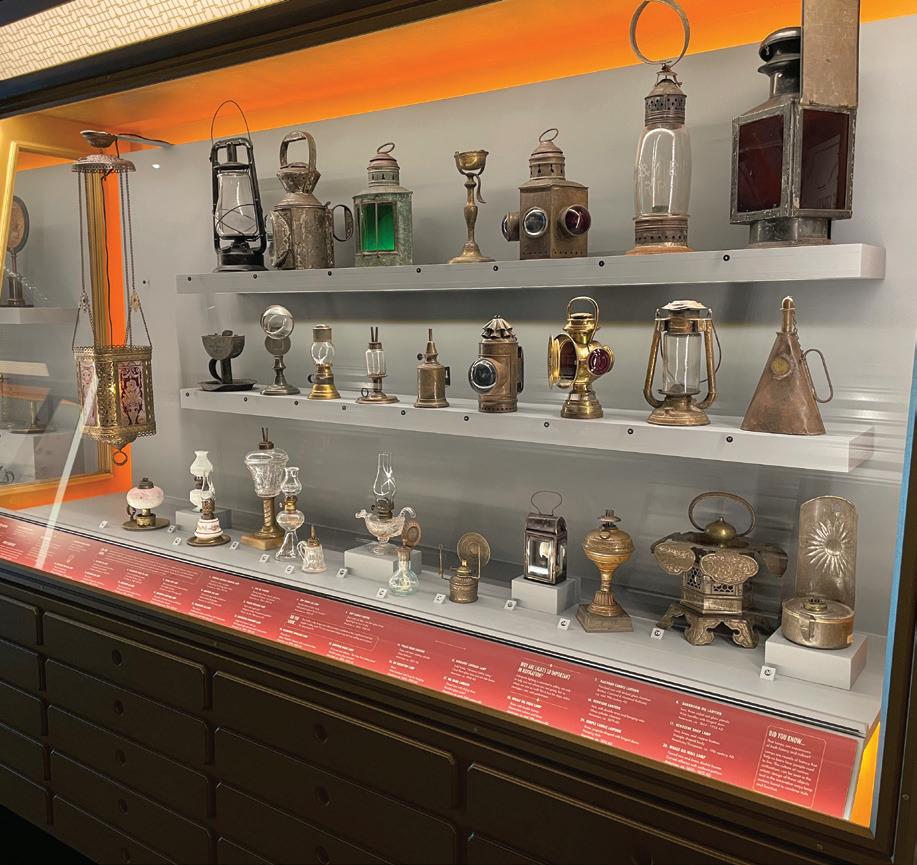
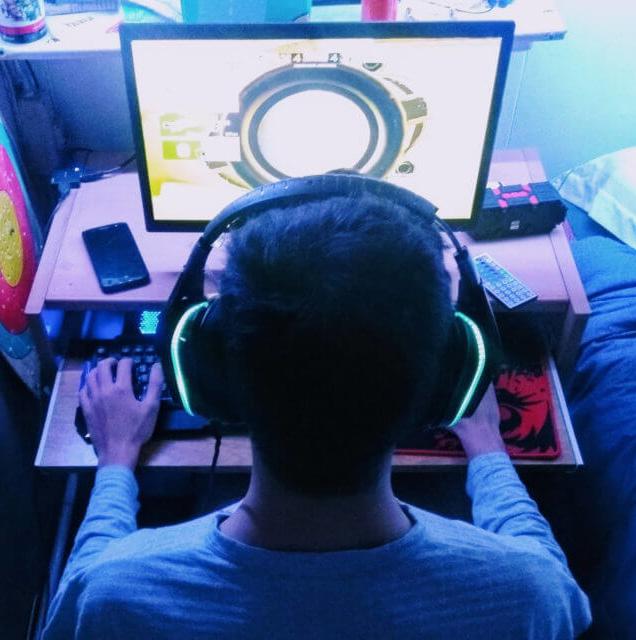
space for anyone to enjoy technology. Staff was super friendly, helpful, and knowledgeable! We loved the Ice Show also! The Vault area was a big hit! Loved getting to look up close at artifacts.”
Science Center Guest October 2022
From the President and Chief Executive Officer
Todd Bastean
Dear Friends of the Saint Louis Science Center,

I am pleased to introduce the ninth edition of Opening Minds to Science – The Saint Louis Science Center’s Report to the Community, 2022
As always, this report presents key findings from our audience research work that happened in 2022, including an overview of our general public visitation demographics, guest satisfaction ratings, and a look at how evaluation informs the development and review of our exhibit galleries and educational programs.
This year, we highlight evaluation work that informed the development of new paleontology exhibits and feedback from campers in the STEMtastic summer camp program, which our Youth Exploring Science (YES) Teens facilitated in two local school districts. We also share key findings from a national study, managed by our Research & Evaluation team, about museum-goers’ perceptions of the impact of climate change.
We closed 2022 with an update to the Science Center’s Vision, Mission, and Values. Sharing what we have learned from our audiences is one way in which we demonstrate being inclusive, community focused, lifelong learners who seek to inspire everyone to be curious and engaged in science.
Sincerely,
1
“I absolutely loved the ESports area! I think it is amazing that you are providing a safe and clean
Co-Authors:
Elisa Israel
Director of Research & Evaluation
Saint Louis Science Center
Rebecca Nall Research & Evaluation Associate Saint Louis Science Center
Table of Contents
Our Data
– Why is this work important?
– How do we learn about our audiences?
4 14
5 16
People Served
– How many people does the Saint Louis Science Center reach?
6 17
General Public Audience Profile
– Who are our visitors?
– Why do people visit the Science Center?
– What do guests do during their visit?
10 12
Guest Satisfaction
–
How do guests rate their Science Center experience?
Exhibit Evaluation
– Paleontology: Past, Present, and You
– How does evaluation inform the development of new exhibits?
Program Evaluation
– STEMtastic Summer Camps
– What did we learn about youths’ experiences in the STEMtastic program?
Cities of the Future Survey
– How do science museum audiences think climate change will impact our cities?
Thank You
3 © 2023 Saint Louis Science Center
Our Data
Why is this work important? How do we learn about our audiences?
Our guests and their experiences are central to everything we do at the Saint Louis Science Center. We use audience research and evaluation to better understand our guests and their experiences with Science Center offerings. This helps the Science Center team make informed decisions in the planning and review of exhibits, programs, and operations. This work is done following best practices in the field of visitor studies.
Data presented in this report were systematically collected and analyzed through a variety of studies, including:
Exit Surveys of adult, general public guests that provide key information, including demographics, visitation patterns, and likelihood of recommending the Science Center. The Science Center is one of more than 30 science museums across North America participating in the Collaboration for Ongoing Visitor Experience Studies (COVES) where all participating institutions collect comparative visitor data through a common exit survey. COVES is managed by the Research & Evaluation team at the Museum of Science, Boston.
Program Evaluation Studies, in which the feedback participants provide through tools such as surveys and drawings are used to assess overall effectiveness of educational programs. In this report, we highlight evaluation of the STEMtastic summer camp program for students in the University City and Riverview Gardens school districts.
Exhibit Evaluation Studies, in which the feedback guests provide via interviews and by testing out prototype exhibits are used to inform the design and development of new interactive exhibits. In 2022, we conducted both front-end and formative evaluation to support the development of new exhibits about paleontology.
Online Community Surveys where members of the Science Center’s Online Survey Panel provide feedback on various topics. In 2022, this included a study about museum-goers’ perceptions about how climate change will affect our cities and communities in the future.
Some of the data that are used in this publication were made available through the Collaboration for Ongoing Visitor Experience Studies (COVES). Neither the Museum of Science (Boston) staff nor COVES bear any responsibility for the results or conclusions presented here.

4
People Served
How many people does the Saint Louis Science Center reach?
The Saint Louis Science Center monitors daily attendance through the use of onsite door counters and by tracking attendance at offsite programs.
In 2022, the Science Center reached 494,788 people. The vast majority, 97.5% (482,367 people), were onsite visitors. The remaining 2.5% (12,421 people), experienced educational programs and community outreach activities at offsite locations such as schools and community centers.
Throughout 2022, the Science Center’s regular operating schedule was five days per week (Thursday – Monday). Due to a spike in COVID-19 cases early in the year, the Science Center was closed for two weeks in late January 2022.
Compared to recent years, the total People Served in 2022 was 130% of the People Served in 2021, 201% of People Served in 2020 (when the Science Center was closed for three months due to the pandemic), and 48% of People Served in 2019, prior to the pandemic.
494,788 People
84.9%
3.2%
2.3%
1.9%
2.5% All Offsite Programming and Outreach
5
General Public
School
5.3%
Groups
Non-School
Groups
Facility
Rentals
Other
Onsite
served in 2022
General Public Audience Profile
Who are our visitors?
Every month, a randomized sample of our adult, general public guests are invited to participate in a survey at the end of their visit. These surveys provide key information on demographics and visitation patterns. In 2022, a statistically valid sample of 1,216 guests were surveyed.
General Public Visitors’ Residence
First Time vs. Repeat Visitors
Four-fifths of general public visitors were repeat visitors. On average, these repeat visitors came to the Science Center 1.7 times during the previous 12 months.
How often do repeat visitors come to the Science Center?
Respondents represented 35 states, plus several countries. The majority of them (64%) reside in the Metro St. Louis area, including St. Louis City, St. Louis County, and the surrounding Metro area counties in Missouri and Illinois.
Science Center Membership Status
Most general public visitors were not current Science Center Members. Members, however, visit more often: Repeat visitors who are Members come an average of 3.6 times per year, while those who aren’t visit 1.4 times per year.
6
89% 12% First Time 21 % 79 % Repeat Non-Members Members 11 % 27% 14% 12 % 36 % St. Louis City St. Louis County Metro Area MO Counties Metro Area IL Counties Tourists All Local Residents - 64% Local Zoo-Museum District Residents - 38% Local Non Zoo-Museum District Residents - 26% CALHOUN 0% LINCOLN 1% JERSEY 0% WARREN 1% BOND <1% CLINTON <1% MACOUPIN 1% ST. CHARLES 8% JEFFERSON 3% MONROE 1% FRANKLIN 1% ST. CLAIR 6% ST. LOUIS COUNTY 28% MADISON 4% WASHINGTON <1% ST. LOUIS CITY 11% 1st visit in 12 months 2–4 visits in 12 months 5 or more visits in 12 months 70 % 25% 5 % TOURISTS 36%
Visiting Group Type and Age Ranges
Although the majority of adults visited in groups that included children, nearly one-quarter visited in adult-only groups. Most adults in groups with children were age 25-44, while most adults in adultonly groups were age 18-34.
Overall General Public Audience Racial Identity
The typical group with children consisted of two adults and two children. Of all the children represented in these groups, 21% were age 0-3, 35% were age 4-7, 32% were age 8-12, and 12% were age 13-17.
Guests in adult-only groups typically come in groups of two; however, some visit in larger groups and others visit by themselves.
Visitors from the St. Louis Metro Area
The racial/ethnic distribution of Science Center guests who reside in the St. Louis area (St. Louis City, St. Louis County, and the surrounding Metro area counties in Missouri and Illinois) is somewhat similar to the 2021 US Census Bureau data for the St. Louis Metro area (the most recent data available); however, among these local visitors, more identified as multi-racial and fewer identified as White.
Highest Level of Education Completed
The Science Center’s adult, general public visitors tend to be fairly well-educated, with over two-thirds holding at least a college degree.
7
2021 US Census Data for St. Louis Metro Area 2022 Science Center Local Visitors White 74% 64% African-American/Black 18% 17 % Asian/Pacific 3% 4% Hispanic/Latino/a/x* 3% 4% American Indian/ Alaska Native 0.1% 1% Multi-racial 4% 9% Other 1% 1%
*The US Census tracks Hispanic/Latino/a/x data separately from race data; total exceeds 100% for the US Census data column.
White African-American/Black Asian/Pacific Hispanic/Latino/a/x American Indian/Alaska Native Multi-racial Other 12% 3% 29% 19% 36% High School Degree 2% Some High School College Degree Some College Graduate Degree Some Graduate Work Ages of Adults in Groups of Adults & Children 65+ 6% 55-64 6% 45-54 11% 35-44 41% 25-34 30% 18-24 7% Groups of Adults Only Groups with Adults & Children 77% Ages of Adults in Groups of Adults Only 65+ 7% 55-64 10% 45-54 9% 35-44 12% 25-34 33% 18-24 30% 5 % 1 % 1% 5 % 66 % 14% 9 % 23%
General Public Audience Profile
Why do people visit the Science Center?
Primary Reason for Visiting
As part of the exit survey, respondents selected their two primary reasons for visiting from a list of nine options. The most commonly selected reason for visiting the Science Center was for the social experience of spending time with others in their group.
Primary Reason for Visiting Today
(Respondents could select up to two options. Total exceeds 100%)
To spend time together as a group/family
For fun/entertainment for group members/children
Something
To see a specific exhibit, program, or show
Motivations differed by group type
People visiting in groups that included children appeared to be primarily motivated by others in their group, most commonly citing spending time together as a group/ family (49%) and fun/entertainment for others in their group (38%).
Of those who selected
“To see a specific exhibit, program, or show,” they most commonly indicated that a special exhibition (Tyrannosaurs: Meet the Family, Hockey: Faster than Ever, or Becoming Jane) (35%), an OMNIMAX® film (28%), or the free exhibit galleries/activities (22%) was what they came to see.
Those visiting in adult-only groups were motivated by a range of things, with nearly one-third (32%) citing spending time with others in their group, 31% selecting something to do while visiting the area, and 27% choosing fun/entertainment for myself.

8
an educational experience
group
For fun/entertainment for myself
relax or relieve stress For an educational experience for myself To support the Science Center 46 % 30 % 16 % 15 % 14% 11 % 6% 5% 5%
to do while visiting the area For
for
members/children
To
General Public Audience Profile
What do guests do during their visit?
Free Galleries and Activity
Areas Visited
Exit survey respondents identified which galleries they spent time in during their visit. Ecology & Environment, home to the Science Center’s iconic animatronic dinosaurs, was the most heavily visited, as it has been in previous years, followed by GameXPloration and Experience Energy.
responses possible. Total exceeds 100%.)
Areas Visited
Most guests spent time in the free galleries. The ExploreStore Gift Shop and the OMNIMAX® Theater were the most heavily visited revenue producing areas.
Free galleries and activities
ExploreStore gift shop
OMNIMAX® film
Food court (near main lobby)
Planetarium gift shop
The Loft (2nd floor snack shop)
Planetarium Star Show Pulseworks/360/VR Flight Simulators
*Special exhibition: Hockey: Faster Than Ever
*Discovery Room
Participated in a paid educational program (e.g. Preschool Science Series)
*Special exhibition: Becoming Jane
92
16 %
* Percentages shown for all items are based on the full year. Life Science Lab – Activity Benches closed March 28, 2022. Life Science Lab – Classroom was closed for updates October 17 – December 31, 2022. Mission: Mars – Control closed October 31, 2022. Natural Histories opened December 26, 2022.
*Percentages shown for all items are based on the full year. Tyrannosaurs: Meet the Family was open January 1-17, 2022 (having debuted in 2021), Hockey: Faster Than Ever was open April 1 – September 5, 2022, and Becoming Jane was open October 9 – December 31, 2022. The Discovery Room reopened June 2022.
How long do visitors stay at the Science Center?
In 2022, visitors stayed an average of 2 hours, 37 minutes. 3 %
hours or longer
9
Ecology & Environment 80% GameXPloration 65% Experience Energy 61% Life Science Lab – Atrium 54% Inside the Vault 52% Mission: Mars – Base 51% Structures 51% Mission: Mars – Control^ 47% Dig Site 41% Makerspace 37% GROW 36% Liftoff 31% Math Cart 24% Life Science Lab – Classroom^ 23% Presentations at the Energy Stage 20% Life Science Lab – Activity Benches^ 4% Natural Histories^ 2%
(Multiple
% 4 hours 4 hr, 59 min 4 % Less than 1 hour 28 % 1 hr to 1 hr, 59 min 34 % 2 hr to 2 hr, 59 min 22% 3 hr to 3 hr, 59 min
9
5
12 % 8% 4% 2 % 2 %
% 23% 17% 17% 17%
*Special exhibition: Tyrannosaurs: Meet the Family 1 % 13%
(Multiple responses possible. Total exceeds 100%.)
Guest Satisfaction
How do guests rate their Science Center experience?
The Science Center’s exit surveys, which use a common set of questions from the multi-institutional Collaboration for Ongoing Visitor Experience Studies (COVES), provide two broad measures of satisfaction: the Overall Experience Rating (OER) and the Net Promoter Score (NPS®).
Overall Experience Rating (OER)
The Overall Experience Rating (OER), which measures satisfaction with the visit experience, was developed and tested by the Smithsonian Institution. Many cultural institutions have since adopted it and it is included on the COVES exit survey tool. The OER asks respondents to rate their visit as “Poor,” “Fair,” “Good,” “Excellent,” or “Outstanding.” By providing an option that exceeds “Excellent,” the OER scale allows for greater differentiation about visit satisfaction than other measures. Guests are also invited to provide a comment to explain their rating.
“I’ve been coming since I was a little girl with my dad; it was the absolute best part of my childhood.”
Science Center Guest
March 2022
“The dinosaur exhibit was the best. My son enjoyed it.”
Science Center Guest
March 2022
“My children were completely engaged and had the opportunity to learn while doing so.”
Science Center Guest
May 2022
“
In 2022, 89% of respondents rated their Science Center experience as “Excellent” or “Outstanding,” suggesting a high level of satisfaction with their visit. The Science Center’s OER ratings were comparable to the OER ratings across the aggregate of the over 30 science museums participating in COVES.
We always have fun at the Science Center! We have been members for years and have fun with all the exhibits, new and old. My kids loved the cardboard maker space.”
Science Center Guest
February 2022
“Staff is very friendly and the planetarium presentation about the solar system was fun. Very informative and fun for myself and my husband.”
Science Center Guest May 2022
10
SAINT LOUIS SCIENCE CENTER, 2022 COVES AGGREGATE, 2022 Less than Excellent Excellent or Outstanding 0.4% Poor, 0.8% Fair 1.2% Fair, 0.3% Poor Outstanding Excellent Good 50% 39% 10% Outstanding Excellent Good 44% 44% 11%
Net Promoter Score (NPS®)
The Net Promoter Score (NPS), which asks guests how likely they would be to recommend visiting the Science Center, is a question used in a variety of service industries. On a scale of 0 (“Not at all likely” to recommend) to 10 (“Extremely likely” to recommend), those who provide a rating of ‘9’ or ‘10’ are considered “Promoters,” those giving a rating of ‘7’ or ‘8’ are considered “Passives,” and those whose rating is ‘6’ or lower are considered “Detractors.” The NPS is calculated by subtracting the percentage of Detractors from the percentage of Promoters, therefore the NPS scores can range from -100 to 100. In 2022, the Science Center’s NPS was 77.9, indicating a high level of satisfaction. For comparison, the aggregate NPS for science museums participating in COVES was 73.3.
“We loved the farming gardens, science lab, dinosaurs, and game room display.”
Science Center Guest May 2022
“Great learning for kids and interesting for adults. OMNIMAX is awesome. Like that the center is free of charge.”
Science Center Guest
August 2022
77.9
Science Center Guest
August 2022
Science Center Guest June 2022
11
“It took all day to explore this place. I am a single adult and still enjoyed most of the exhibits and activities the center has to offer.”
“ I loved the Science Center as a child and it’s still fascinating today. Love seeing my child’s reaction of wonder.”
-100 100
Science Center’s NPS in 2022
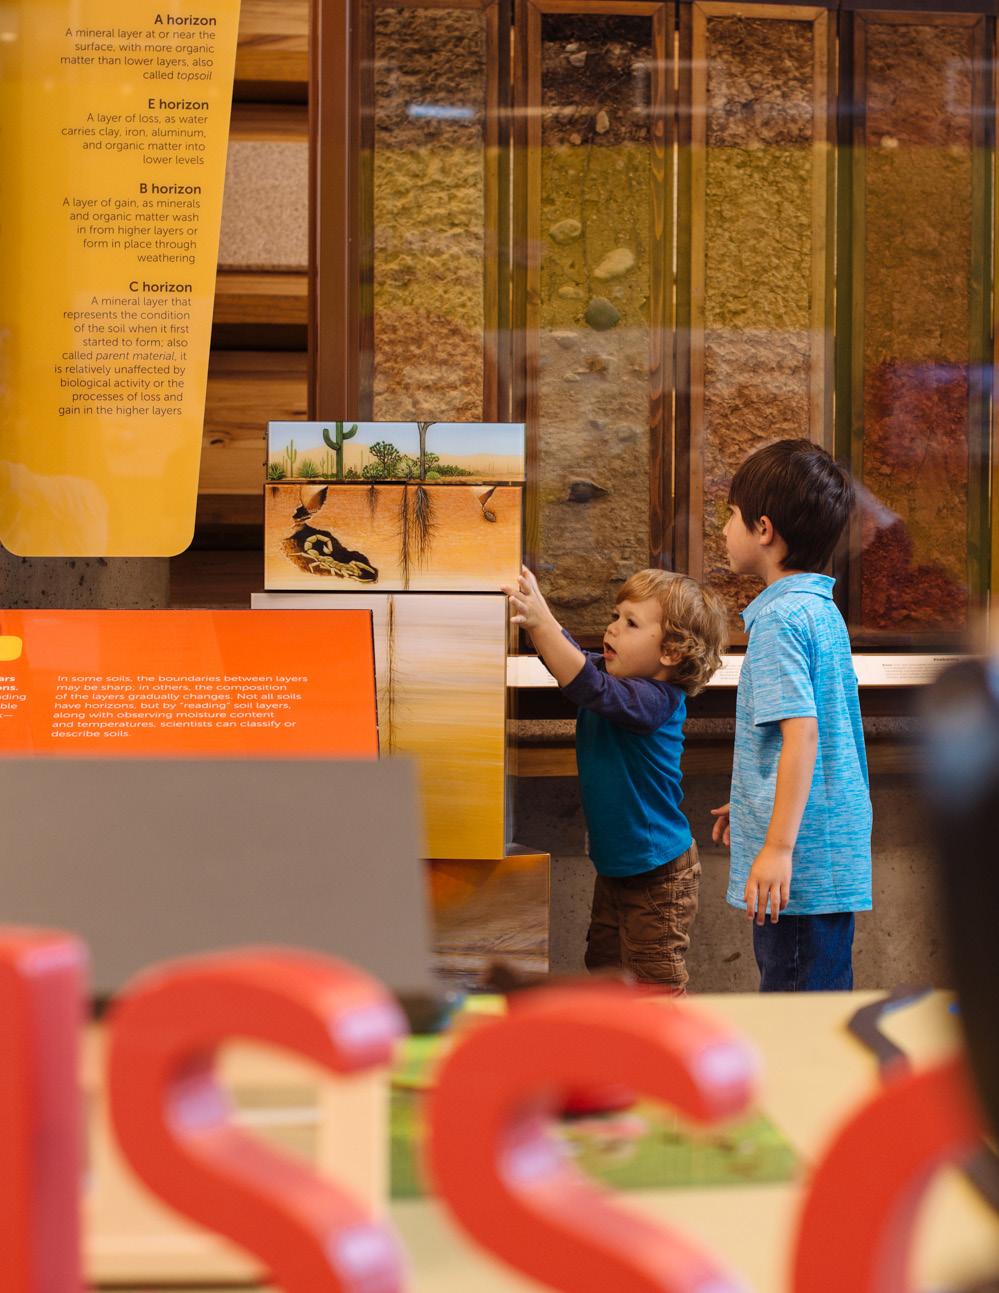
Exhibit Evaluation –
Paleontology: Past, Present, and You
How does evaluation inform the development of new exhibits?
Front-end and formative evaluation are two phases that inform exhibit teams as they develop and refine concepts for new exhibits. In front-end evaluation, we learn about what audiences know, are interested in, or have questions about on a certain topic. In formative evaluation, we improve exhibit design by including visitors in iterative testing of exhibit concepts to test and refine both functionality and communication of educational content.
In 2022, we updated a portion of the Ecology & Environment gallery with new exhibits about paleontology and how understanding the fossil record helps us make better decisions to care for our world. We conducted frontend evaluation interviews with 59 visitors, both adults and children, in 30 groups. In the formative evaluation phase, we tested multiple iterations of three prototype exhibits with a total of 215 visitors, both adults and children, in 71 groups. Here, we present highlights of findings from the front-end evaluation and from the formative evaluation of one of the prototypes, both of which shaped the final exhibit design.
Front-End Evaluation Key Findings
• Although dinosaurs are the most common primary association, both children and adults recognize that paleontology is about more than dinosaurs.
• Children’s understanding for the reasons to study fossils focused on learning about the past in general or learning about past life more specifically, particularly dinosaurs. They generally did not describe connections between studying the past and understanding current or future issues related to topics such as climate.
• Adults also focused on learning about past life, but often referenced the ability to make connections between the past, present, and future, indicating that some adults recognize how studying paleontology can intersect with climate science.
about past life
about dinosaurs
Because
Make
to
about people
Learn
12
comparisons
• Children expressed interest in seeing examples of more varieties of dinosaur types as well as fossils other than dinosaurs. Adults’ interests were more varied and included seeing examples of local fossils and learning how to find and identify fossils. today
about the past
Learn
Learn
it’s cool
how animals lived/changed
Learn
See
about animals
Learn
in general
know To put in a museum
about Earth
Learn
Don’t
Learn
YOU THINK PEOPLE STUDY FOSSILS?”
responses coded into multiple catigories. Total exceeds 100%.) Children (n=19) Adults (n=28) 37 % 18% 21 % 32 % 21 % 7 % 11 % 10 % 5 % 14% 0% 21 % 0% 11 % 0% 7 % 0% 4% 5% 0% 5% 0% 4% 0%
“WHY DO
(Some
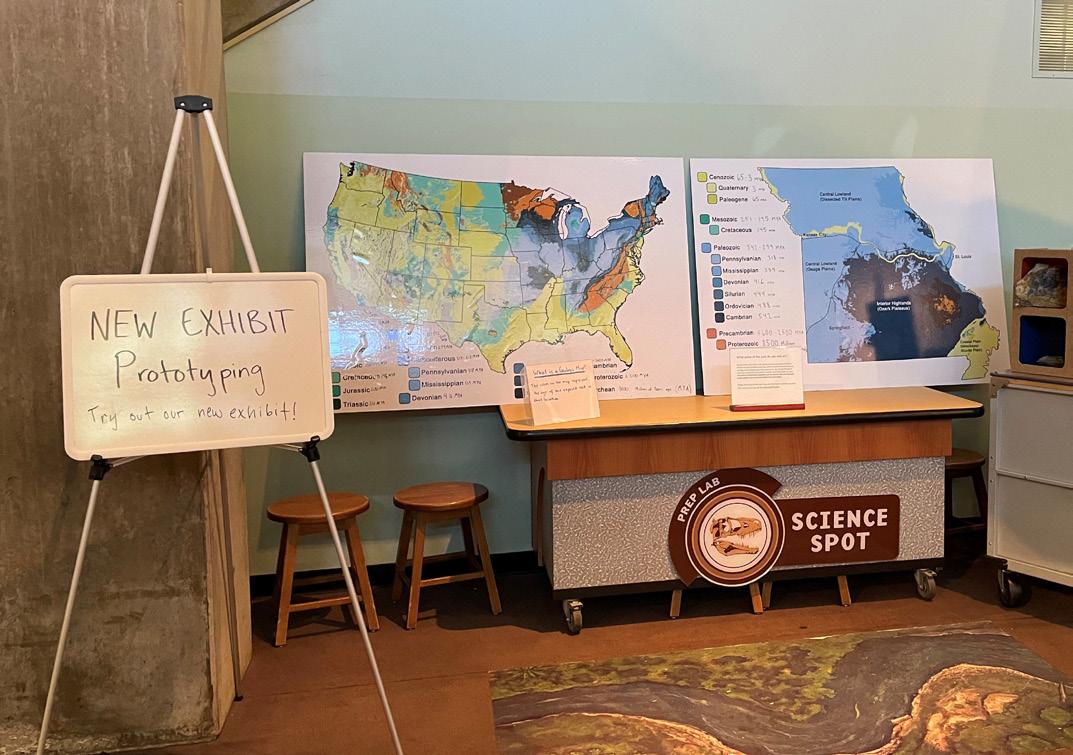
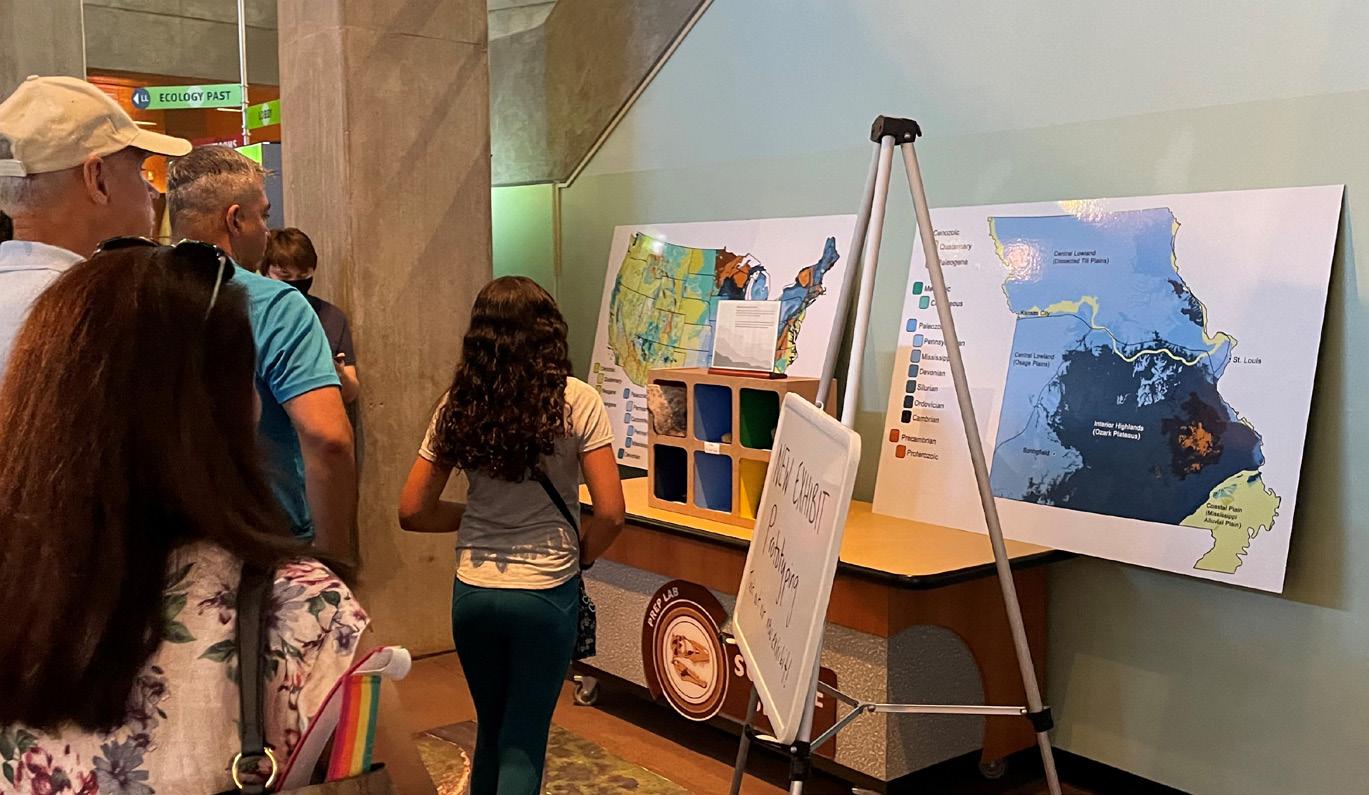
Formative
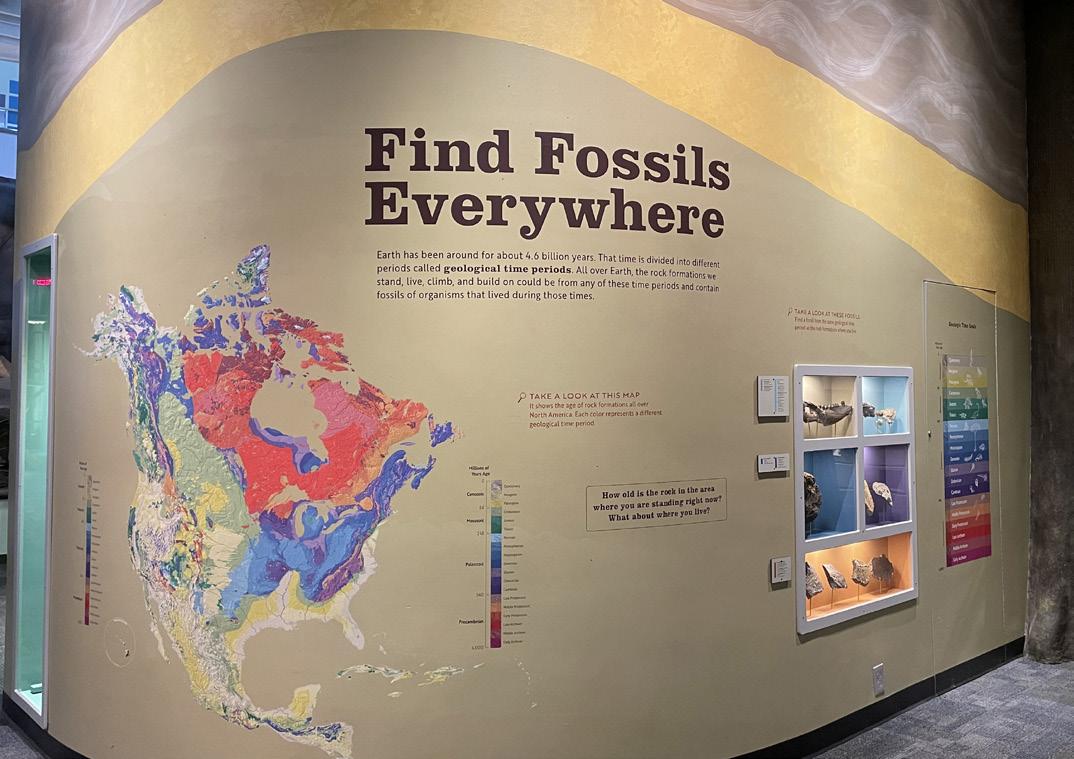
Evaluation Highlight – Geologic Maps
The Concept
Visitors use geologic maps of Missouri and the United States to identify the geologic period of exposed rock where they live. They then examine examples of fossils associated with that timeframe.
What Worked
• Most visitors studied the maps and connected the colors on the maps to the colored boxes holding fossils.
• Adding labels to the maps to indicate the timeframes of different geologic eras was helpful.
• People realized that fossils can be found throughout Missouri.
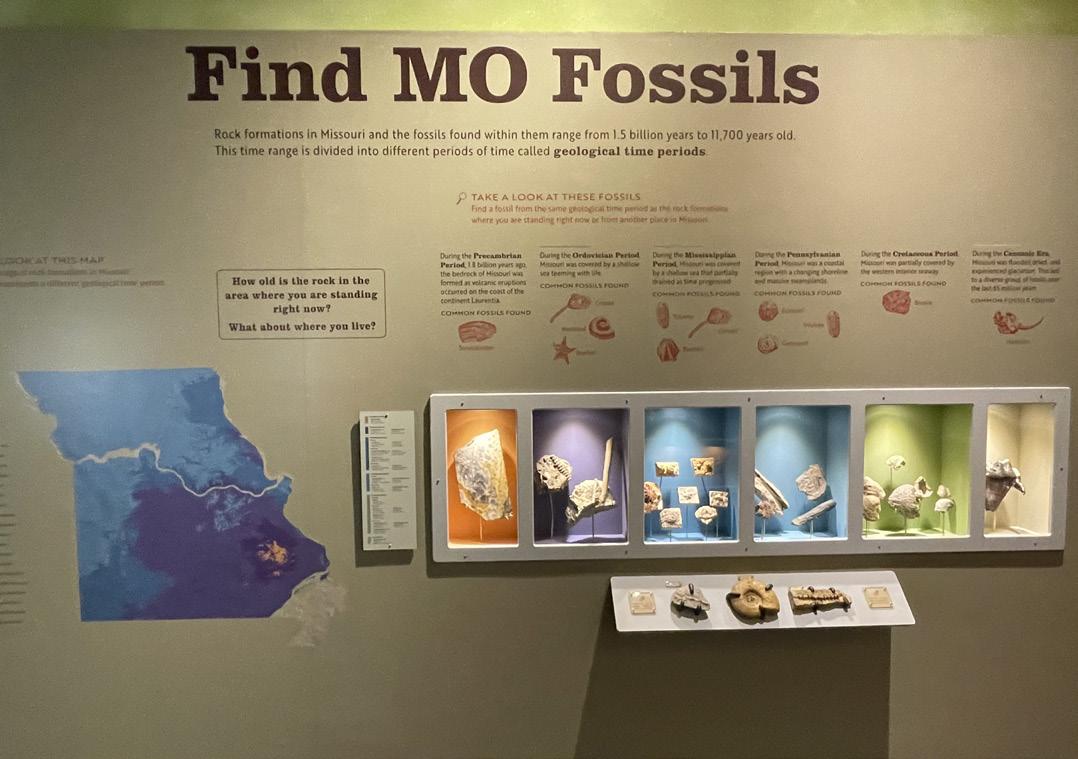
What Didn’t Work
• Several misconceptions emerged about what the maps show, including assumptions that colors on the map related to climate in different areas or indicated different types of environments (e.g., assuming that red indicated volcanos and blue indicated water), rather than ages of exposed rock.
• Some guests were interested in additional information, such as rock type and how plate tectonic movement would have affected locations of fossils over time.
• Relative placement of the maps and the fossils affected how often people made connections between the two.
The Final Exhibit
• The United States and Missouri maps were presented on opposite walls, each with their own set of fossil examples.
• In addition to a small, color-coded reference timeline next to each map, a larger timeline graphic that included drawings of key species, was included on the wall next to the fossils associated with the United States map.
13
Completed exhibits.
Third iteration of the prototype exhibit
Program Evaluation –STEMtastic Summer Camps
What did we learn about youths’ experiences in the STEMtastic program?
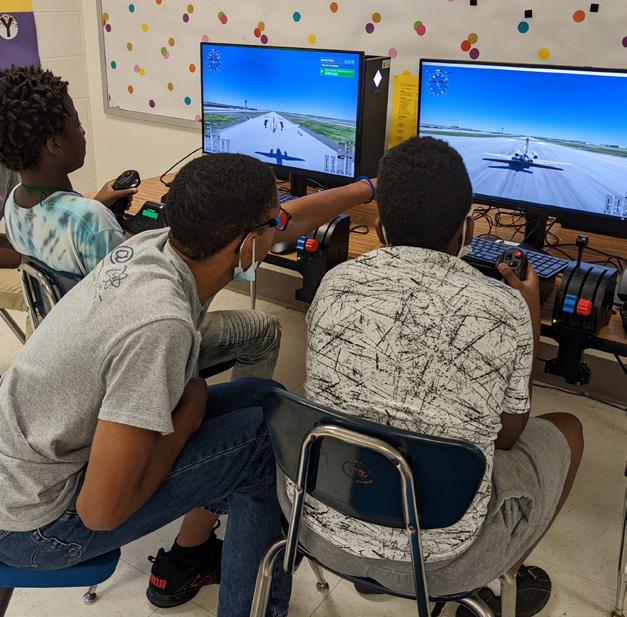
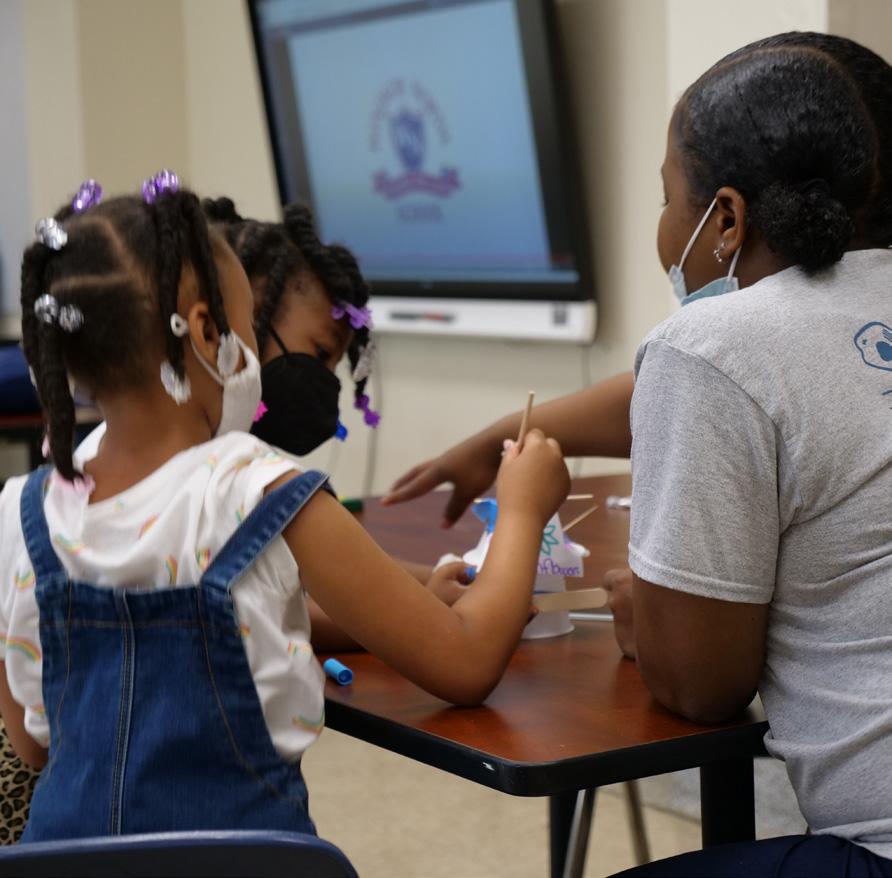
During Summer 2022, as a part of the Boeing Global Engagement Grant, the Saint Louis Science Center conducted two thematic STEMtastic summer camps about Aerospace and Coding for elementary school students in the Riverview Gardens and University City school districts. Science Center staff and teens from the Science Center’s Youth Exploring Science (YES) Program facilitated the camps over four weeks during the summer.
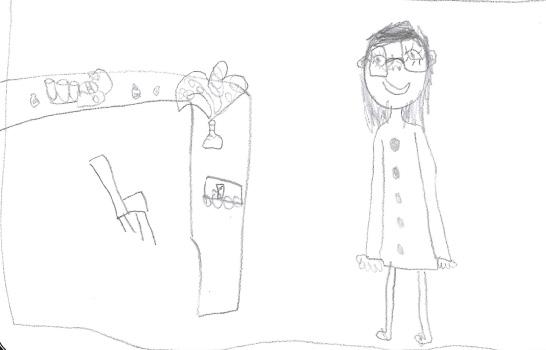
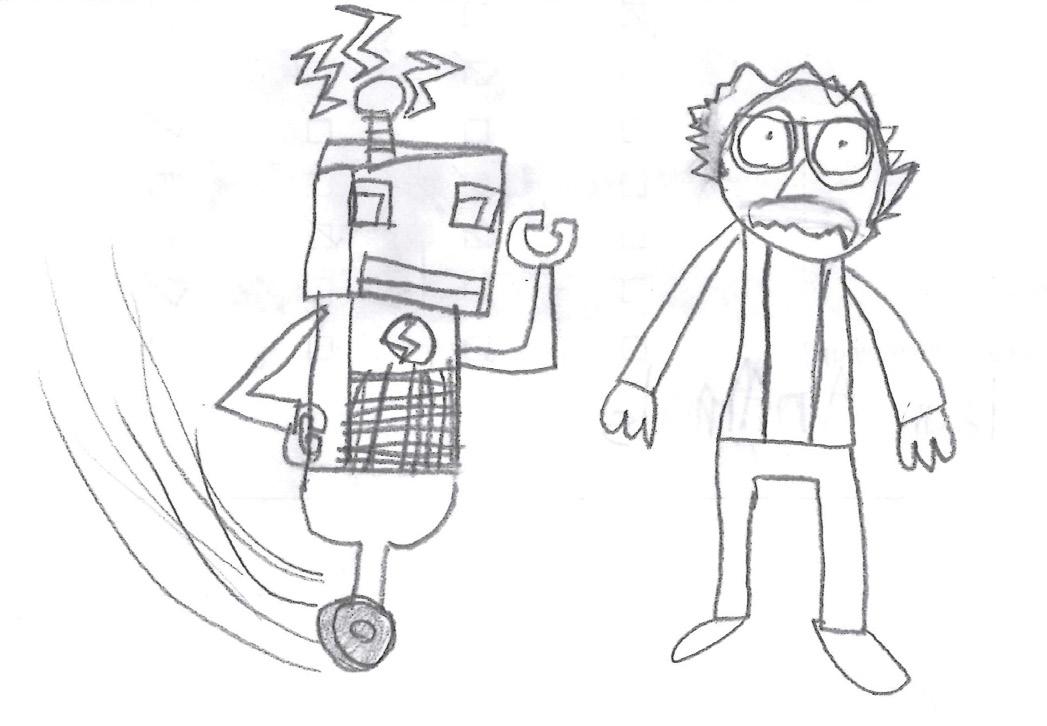
In addition to facilitating the camp program, Science Center staff and YES Teens collected feedback from campers about their experience in the STEMtastic summer camp program. Campers completed a survey that included rating questions, open-ended questions, and a space to draw a “computer coder” or a “scientist,” based on the camp they attended. These surveys were administered at the beginning and end of camp, which allowed for some pre-post comparisons. A total of 56 surveys were collected from both camps at Riverview Gardens and 601 were collected from both camps at University City.
Aerospace Camp:
Girls, in particular, showed significant increases in their interest in and knowledge of astronomy over the course of the camp:
• Girls’ interest in learning about astronomy increased from a mean rating of 2.4 to 3.0 out of 4.
• Girls’ self-assessed knowledge about astronomy increased from a mean rating of 2.2 to 2.6 out of 4.
14
Figure 1. Draw a Scientist, before Aerospace Camp – Boy, Age 7 Figure 2. Draw a Scientist, after Aerospace Camp – Girl, Age 6
Coding Camp:
Campers were able to see the results of coding in a real and tangible way:
• At the beginning of camp, only about 40% of students’ drawings of computer coders included a person. By the end of the camp, this increased to 50%.
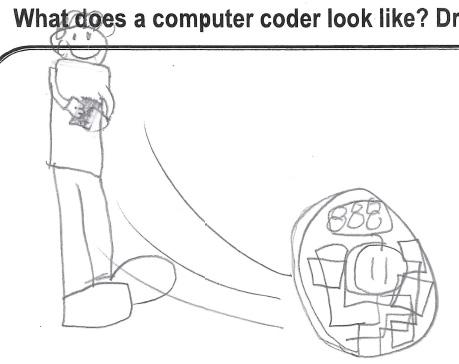
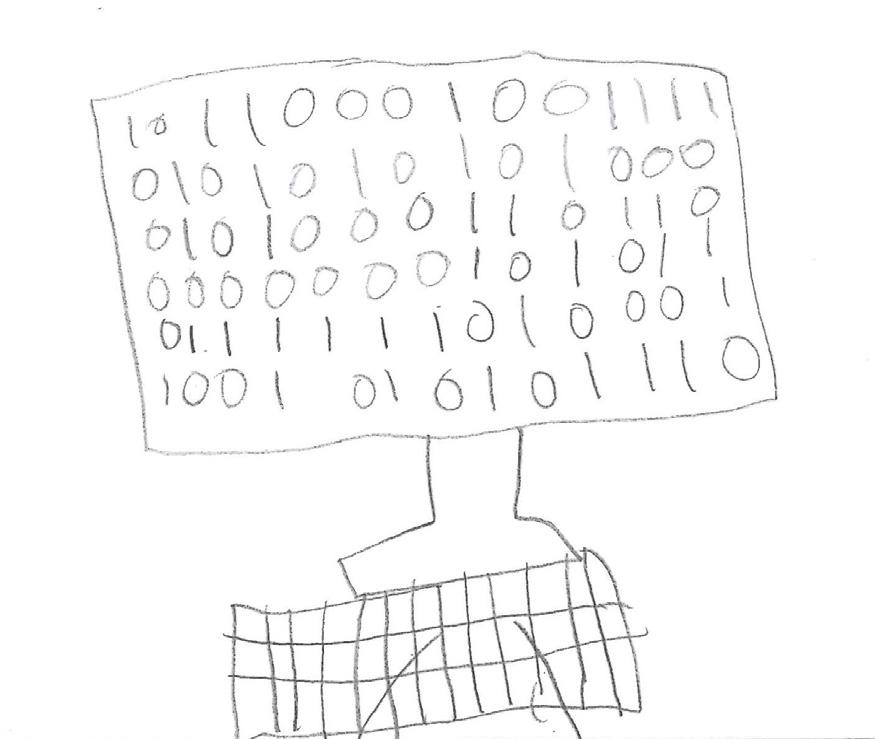
• Several of the post-camp drawings also included a depiction of the Sphero robots – small, baseball-sized robots that can be coded to do specific activities and controlled via a smart phone. They were a prominent camp activity.
• Campers enjoyed Sphero so much, in their comments many requested more time coding with Sphero.
Campers at both camps:
Across both camps, students had strong understanding about the importance of teamwork:
– Aerospace Camper, Age 10
“Because people may need help.”
– Aerospace Camper, Age 10
15
“ You can accomplish more together than alone.”
– Coding Camper, Age 8
“ Working with a partner makes something easier.”
– Coding Camper, Age 6
Figure 3. Draw a Computer Coder, before Coding Camp – Girl, Age 10
Figure 4. Draw a Computer Coder, after Coding Camp – Boy, Age 7
“Teamwork is important in science because you can’t do things by yourself.”
Cities of the Future Survey
How do science museum audiences think climate change will impact our cities?
In Fall 2022, MacGillvray Freeman Films, in partnership with the American Society of Civil Engineers, and with support from the Science Center’s Research & Evaluation team, conducted a nationwide study to better understand museum-goers’ perspectives on climate change and its impact on the future of our communities. Nine science museums, from across the United States and Canada, collected feedback from a total of 777 respondents, 138 of whom came from the Saint Louis Science Center’s Online Survey Panel. Results presented here are from the full set of respondents.
Respondents’ feelings about new technologies related to climate change
65% 53%
51% were “Excited” about Renewable Energy.
Impact of climate change on respondents’ personal lives
Urban and suburban residents were more likely than rural residents to feel that climate change would have a big impact on them personally.
were “Curious” about High-Tech Building Materials.
were “Worried” or “Uncertain” about Self-Driving Vehicles.
Interest in advances in the future of transportation technologies
Percentage of respondents who were were “Extremely” or “Very” Interested in learning about...
56% High-speed alternatives for long range travel
Interest in advances in building technologies
54% Electric vehicles
Percentage of respondents who were “Extremely” or “Very” Interested in learning about...
61% 59%
49% Green roofs Recycled building materials
High-tech building materials
Most and least trusted sources for information about climate change and future technologies
Most Trustworthy: Scientists
16
Urban 58% 32% 7% 4% Suburban 44% 41% 9% 6% Rural 34% 39% 14% 13% Big impact Some impact Only a little impact Not an issue that affects me
4.0 out of 5
3.8 out of 5
3.7 out of 5
1.5 out of 5
Highly Trustworthy: Museums/Science Centers
Highly Trustworthy: Engineers
Least Trustworthy: Social Media
Thank You!
Through all of our evaluation studies, we collected over 4,328 points of data from our audiences in 2022!
Thank you to everyone who completed an exit survey, responded to an online survey request, tried out an exhibit prototype, or participated in an interview.
We hope you gained some new insight with this glimpse into our visitor studies work from 2022. These data provide valuable insights about who visits the Science Center, why they visit, and what they do on site. This information is critical to updating and improving the Science Center experience.
Thank you to the guests who come to explore galleries and see shows. Thank you to the people who participate in Science Center programs both within our walls and out in the community. You are why we are here.
Finally, thank you to all our supporters. Without you, we would not be able to fulfill our mission to inspire everyone to be curious and engaged in science.
17
Saint Louis Science Center, 5050 Oakland Avenue, St. Louis, MO 63110
